Create interactive graphs logging Arduino data with Plotly
Zoe Romano — November 4th, 2013
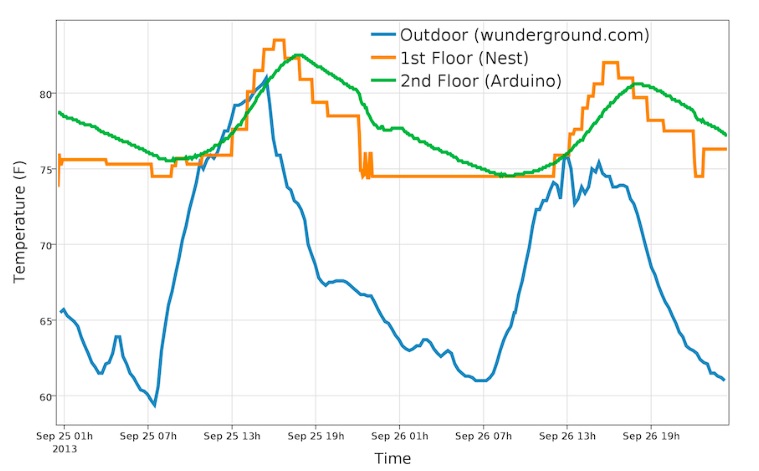
Plotly is a platform for analyzing and beautifully visualizing data imported from Excel spreadsheets, CSV, TSV, Matlab data files, MS Access, text but also data streaming from any hardware device. Matt, one of the co-founders wrote us that they’ve just released a beta of the Arduino API, that allows to continuously transmit data or transmit a single chunk of data from Arduino and then make interactive graphs in the browser.
They’re a quite new startup (just three months in) so if you are a scientist, student, engineer, analyst, maker and you haven’t test it yet, give it a try!
We care about the privacy and personal data of our users.
To continue, please give us your consent:
Please confirm that you have read the privacy policy
Thank you for subscribing!
Curious to learn more?
Are you also a teacher, student, or professional that loves using Arduino in your day-to-day activities?
Then keep up-to-date with either our STEM or Professional monthly newsletters.
Arduino weekly newsletter (already subscribed)
Educators can benefit from the ever growing tech that shapes our environment through fun cool projects.
Why not awe your boss with highly innovative ways to help keep your enterprise connected at no extra cost?
Arduino Survey
We'd like to get to know you little better.
Please help us improve by answering this super short optional survey.