Monitoring and visualising dual temperature and humidity sensor
— January 10th, 2014

We recently featured Plotly and discovered how easy it is to analyse and beautifully visualize data using their platform and API.
Now they shared with us a simple instructable to show to Arduino Community a hands-on experiment with ambient sensors:
The purpose of this instructable is to demonstrate how to hook up an Arduino + Ethernet Shield and send data to Plot.ly’s Servers and create beautiful graphs. We will be using a dual temperature+humidity sensor (DHT22), and sending the results directly to Plotly.
Follow these easy steps, here’s what you’ll need:
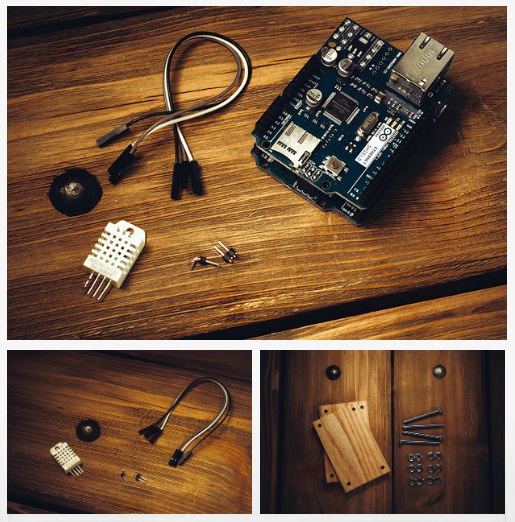
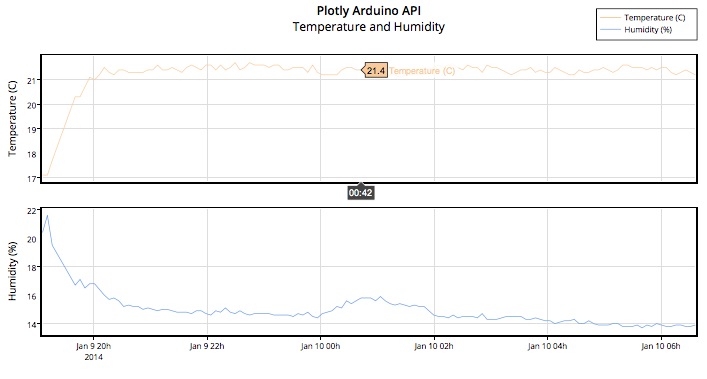
And this is an example of the output:
Categories:Arduino