5 ways to visualize your Arduino or ESP sensor data

For users delving into the world of DIY IoT, one common challenge that they frequently find is how to effectively visualize the data generated by their devices, using mobile apps or web browsers. These devices, often built around Arduino or ESP boards, empower makers to craft innovative solutions for a wide range of applications. However, the missing piece of the puzzle is to find a simple, straightforward and reliable way to visualize and interact with the sensor data.
For example, imagine that your device is controlling humidity with an ESP32 device and you want to be able to visualize your data in real-time fairly quickly so that you can take actions based on specific events. Well, there are many ways to publish sensor data. Some require time and others are faster to set up. In this blog post, we will go over five of the most common methods, describing their advantages and limitations. We will introduce the Arduino Cloud as an easy-to-use IoT solution for all skill levels and with zero maintenance.
5 most common IoT data visualization methods
1. Use a mobile app to visualize data connected via Bluetooth®
Bluetooth is a popular choice for connecting IoT devices to mobile apps. Users can establish a Bluetooth connection, send data from their IoT device to the mobile app, and visualize it in real-time.
Numerous examples of mobile apps and libraries specifically designed for this purpose are available.
- Home Automation Using Arduino and Bluetooth Control
- Temperature Monitoring on Smartphone | Arduino Project Hub
- Measuring temperatures with LM35 and DS18B20 | Arduino Project Hub
Following some of these examples can be easy for medium skill programmers, but it can become a bit tricky when requiring a more advanced visualization solution. Ready-to-use apps are too generic and not flexible enough if you desire a custom dashboard.
Local solutions, like Bluetooth, require you to be physically close to your IoT device to access data, which limits remote monitoring and control.
2. Embed a web server in the device
Embedding a web server inside the IoT device allows you to visualize the data using a web browser. It requires the device to have network connectivity, and it is usually implemented connecting the device to a Wi-Fi access point or with the device creating its own WiFi hotspot.
Although creating your own web server implementation can be done, one of the most widespread solutions is to make use of the library ESPAsyncWebServer. It allows your IoT device to serve custom HTML pages presenting the data. This is a very flexible and customizable solution, yet complex and mostly suitable for skilled users.
There are plenty of insightful examples like the following ones:
- ESP32 Web Server – Arduino IDE | Random Nerd Tutorials
- Arduino Project Hub – NodeMCU ESP8266 AJAX Enabled Web Server
- Arduino Project Hub – WiFi Robot Car / RC Car NodeMCU Web Server
- ESP32 Web Server: Display Sensor Readings in Gauges | Random Nerd Tutorials
The scope of this solution is typically local — you need to be on the same network as the device — although with a more advanced configuration by enabling port forwarding in the router, the device could be accessed remotely from anywhere.
One of the main advantages is its low latency, as the data shown in the web page comes directly from the device without any processing.
On the other hand, it is a solution that requires a high programming skill level and additionally, due to the immutable nature of the firmware, every change in a dashboard requires code recompilation and firmware reflashing.
Furthermore, embedding a web server or a Bluetooth stack within the device can be resource-intensive. This may limit the device’s capabilities or require a more powerful microcontroller, increasing both cost and complexity.
3. Send data to an external system with plotting capabilities
IoT devices can send data to external systems using different protocols, such as MQTT or HTTP. Although there are many HTTP based implementations, the ones based on MQTT are the most popular ones, and it has become the de-facto standard in IoT communication due to its lightweight, efficient, and publish-subscribe model, making it well-suited for resource-constrained devices and scalable, real-time IoT applications.
Sending data to external systems relies on external infrastructure. At least, the following components are needed:
- A server that receives (and stores if needed) the data
- A web server implementing the application that allows the user to access and visualize the data
Both components can be running on the same machine or on different machines. These machines can typically be self-hosted or cloud-hosted.
- Self-hosted platforms: You own the infrastructure — typically in your home or premises — and the machines where the monitoring application runs. There are usually two different ways to implement these systems:
– Deploy an (open-source) application on your machines that can be used right away.
– Build your full system on your own. - Cloud-hosted platforms: The infrastructure and the machines are in a cloud owned by the application provider.
Regardless of the solution you opt for, some systems offer the ability to integrate with external systems, offering the opportunity to disseminate data across various platforms. One common approach is to facilitate data transfer to platforms such as IFTTT, a widely adopted choice. IFTTT can further facilitate actions like storing data in a MySQL database or appending rows to a Google Sheet.
Let’s deep dive into three examples: Two self-hosted and one cloud-hosted.
3.1. Use a ready-to-use self-hosted system
Self-hosted ready-to-use solutions are very popular and consist of deploying an open-source monitoring application on a machine (usually Linux-based) which is located in your home or premises. For this, you need to build and maintain the infrastructure and guarantee that the machine where the application will be running is available 24/7.
Some very popular open-source examples are Domoticz, openHAB or Home Assistant. They are extremely flexible and full of add-ons or extensions contributed by the community.
Installing these systems can be a straightforward process on the recommended platforms (hardware plus Operating System) but it can become a bit tricky when you want to install them on systems that are already running, as conflicts with the Operating System (OS) or the libraries of the system usually arise and they are usually not very easy to solve. So it can change from an easy task that a beginner can do to a complex task only suitable for skilled users.
Dealing with software updates for the application or the Operating System can become a complicated task as usually conflicts between dependencies arise.
As the add-ons and extensions are developed by the community, they are often not maintained and so they can be buggy and may not work properly across different versions of the application.
Accessing the system remotely from the internet requires opening your router ports and configuring port forwarding, which is something not very intuitive for beginners and that can create security threats in your network.
3.2 Create your own MQTT-based visualization system
This self-hosted solution is the most complex of all the ones described so far, yet the most flexible one.
As an example, imagine that you want to create your own monitoring system using MQTT to populate the data, a database to store it and a visualization platform to plot it. In that case, you need to have one or several machines running:
- The MQTT broker. One of the most popular open-source ones is Eclipse Mosquitto.
- The application that will subscribe to the data in the broker and store it in a database. Using time-series databases (TSDB) like InfluxDB is gaining popularity.
- The visualization platform that will allow you to create dashboards accessible via a web browser. Grafana is one of the most popular open-source platforms to achieve this.
Furthermore, you also have to configure the network so that the machines and the services can talk to each other and so that they can be accessible remotely from the internet. As in the previous method, this means opening your router ports and creating security holes in your network.
And last but not least, you have to configure and maintain the full infrastructure of servers and network.
3.3. Use Arduino Cloud to store and visualize your devices data
The Arduino Cloud is a cloud-hosted platform that provides a user-friendly environment to develop the software of the IoT devices and to create customizable insightful dashboards used to monitor and control your IoT devices.
The main features are:
- Online editor or Arduino IDE development: You can develop your projects online from anywhere. No configuration is required from the user to use the online development environment. But, even though online development is very convenient for many users, the development with the popular and well-known Arduino IDE is equally valid. You can choose the right one for you.
- Code storage and backup: Whether you develop offline or online, storing your code in the cloud eliminates the need for manual backups and enables development from anywhere.
- Customizable dashboards: You can create and customize your dashboards with an intuitive interface using drag-and-drop widgets. They provide real time interaction with your IoT devices and insightful historical information that can be additionally downloaded for offline analysis. The good thing is that you can share them with friends, colleagues and family as well as set up real-time alerts.
- IoT Remote app: Your dashboards are always at your fingertips with the mobile phone app.
- Work collaboratively: You can share your code and dashboards with others.
- Out-of-the box integrations: You have seamless integration with popular platforms like IFTTT, Zapier, Google Services, or Alexa.
- Wide range of compatible devices: You can connect not only Arduino or ESP-based boards, but also any device programmed using Python, JavaScript or MicroPython.
It is free to use for small-sized projects. If you need to connect more devices or need to access premium features such as extended data storage, support for larger projects, over-the-air updates, real-time notifications, you can sign up for a monthly or yearly plan (starting at $2 per month). .
The main limitation of this system is that you require internet connectivity to visualize your device’s data.
Other solutions
These are just some examples, but there are of course many more. It’s worth noting that some users explore hybrid solutions where they maintain their own Cloud-hosted infrastructure. However, these solutions incur in the problems highlighted for both self-hosted and cloud-hosted solutions. Others use websockets to stream data directly to their web pages or applications.
Conclusion
IoT data visualization doesn’t have to be a complex, expensive, or location-dependent task. The selection of the right solution for you depends on your use case and specific needs.
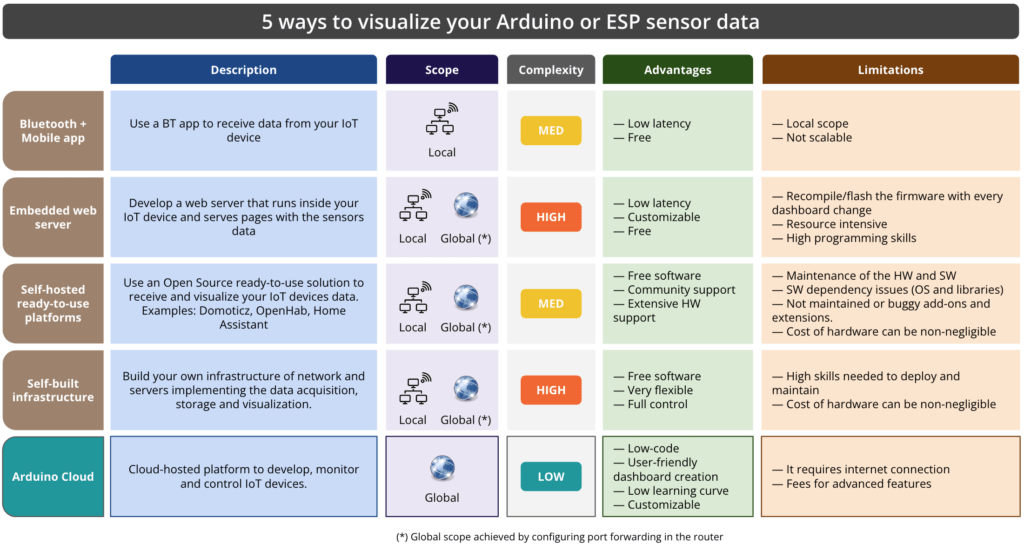
In this blog post, five popular solutions have been presented and they are summarized in the following table:

Here are the key takeaways from this table:
- Local scope solutions, like Bluetooth or embedded web servers, require you to be physically close to your IoT device to access data, which limits remote monitoring and control. Providing full global access for some of these solutions requires your router port forwarding configuration, which may create security breaches in your network.
- Embedding a web server or a bluetooth stack within the device can be resource-intensive. This may limit the device’s capabilities or require a more powerful microcontroller, increasing both cost and complexity.
- Self-hosted ready-to-use platforms have been traditionally the most widely adopted because of its open-source nature, flexibility, community support and wide range of add-ons and extensions. These solutions demand that you build and maintain the infrastructure, making them sometimes complex and time-consuming. Additionally, although the software is free to use, the hardware where they run is becoming increasingly more expensive and difficult to find.
All these limitations have contributed to the popularity increase of cloud-hosted solutions mainly because of their convenient unattended nature, but also because they simplify the development of the devices firmware, their scalability and their level of customization. The main limitations of these solutions are their dependency to an internet connection and that they may incur some costs when advanced features are required.
In this blog post, we have introduced the Arduino Cloud, a cloud-hosted platform designed to simplify the entire process, from firmware development to monitoring and controlling devices from anywhere. The Arduino Cloud was created with the goal of democratizing IoT, much like how Arduino has empowered makers to create with ease. As we have explored, the Arduino Cloud’s online development features, code storage, and intuitive dashboards make it an appealing choice for IoT enthusiasts.
Start with Arduino Cloud for free
Getting started with the Arduino Cloud couldn’t be easier. You only have to follow these steps:
1. Set up an Arduino Cloud account.
2 Connect your IoT device to the Arduino Cloud.
3. Create your Thing and add your software to read your sensors data.
4. Create dashboards for data visualization.
And that’s it. It’s ready to use and it is free. You can explore the premium features for enhanced functionality.
So, if you’re looking to streamline your IoT data visualization, consider giving the Arduino Cloud a try and unlock its full potential for your projects.

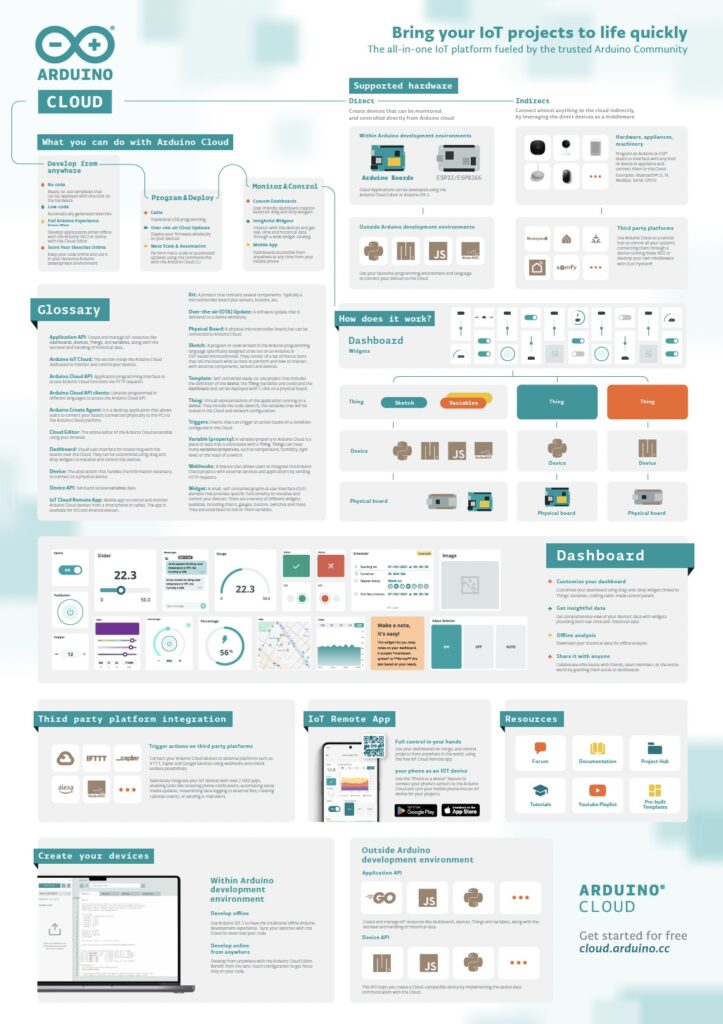
Have you ever wondered what the Arduino Cloud is all about? Dive into the world of possibilities with our all-in-one A3 cheat sheet. Download it now!