Statistics are skyrocketing
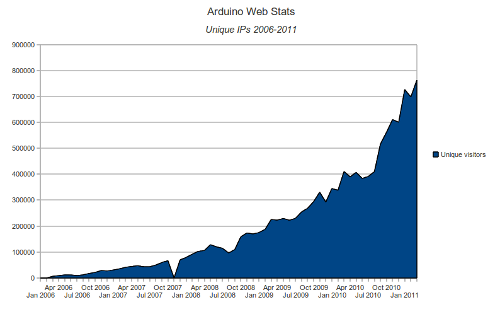
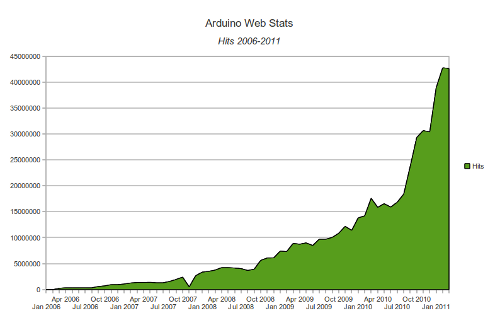
We are lucky to have been keeping track of our data more or less since we started. After 6 years online we can now show the graphs displaying the evolution of our website from 0 to 750.000 users per month. We are aware network monitoring is an art and that we probably don’t have the best tools to show our numbers, but the values are remarkable anyway. Here the graphs for amount of unique IPs during the last years, as well as the hits/month, where we are about to reach 45.000.000 in total for a 31 days period. The users and hits increased by factor 2x and 3x respectively during the last year.

(cc-sa-nc) 2011 Arduino Team
A deeper analysis of the data shows how it is around March-April every year that the server gets the biggest load and how things stabilize again until September … I wonder how many of our users are students going crazy looking for information on the website during the project implementation phase of their classes.
I should note that there is much more data in our system that I am still digesting. For example, most of Arduino users access out system from a Windows computer (70%), Mac OSX users have a share of 14% while Linux keeps a honorable 11%. The rest goes for all sorts of weird devices that get to browse our site … are there still Symbian phones out there?
As a happy Open Source user, I am proud to announce that FireFox is still going strong as the main browser to visit the site (40%) … let’s see if the latest FF4.0 will get those numbers to improve over the following months.

(cc-sa-nc) 2011 Arduino Team