Visualizing temperature and humidity with Plotly from a mountain edge
— March 10th, 2014
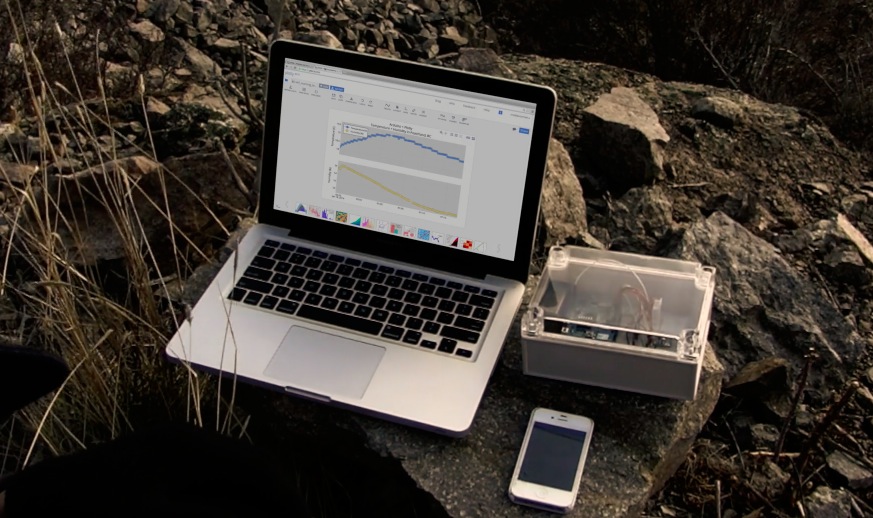
Matt from Plotly team, sent us this cool video about streaming remote temperature + humidity data with an Arduino Uno and visualizing with Plotly from a mountain edge, in Peachland, BC.
The Arduino (We’re using the UNOr3) was connected to wifi tethering from a mobile (through a WIFI Shield), from there it received data from a DHT22 temperature + humidity sensor and streamed to Plotly’s servers, to be visualized. View streamed data: plot.ly/1023/~demos
Enjoy the video and the beautiful visualisations!
Categories:Arduino